New analytics and customization options are now available for all users!
What's new in Analytics?
Up to this update, we only showed you the number of comments and page views your website got in a time period. Now, you can see them in a more comprehensive way with our new beautiful charts.
In the analytics section of the console, you can see how your website performed in the following time periods.
Today - Grouped by hour
Yesterday - Grouped by hour
Last 7 days - Grouped by day
Last 30 days - Grouped by day
The first metric is the number of comments.
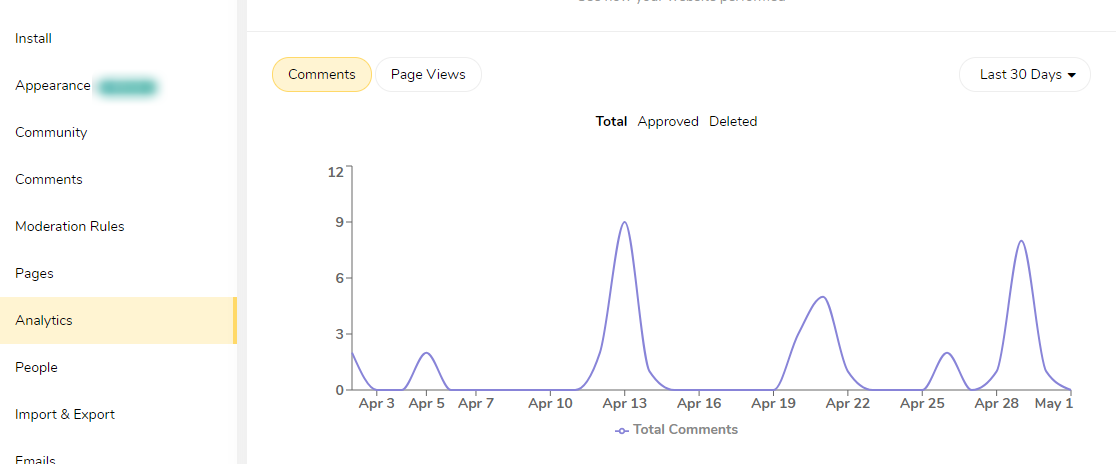
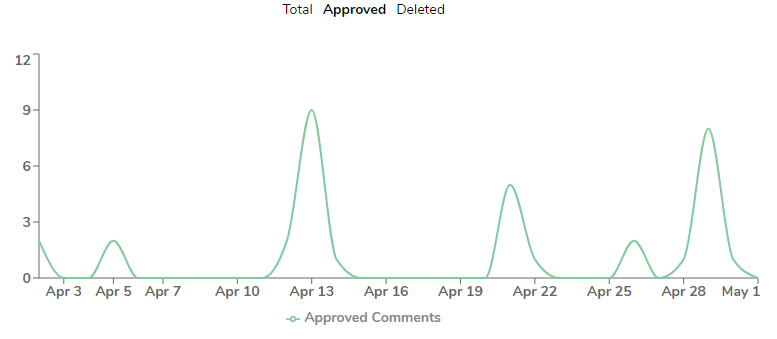
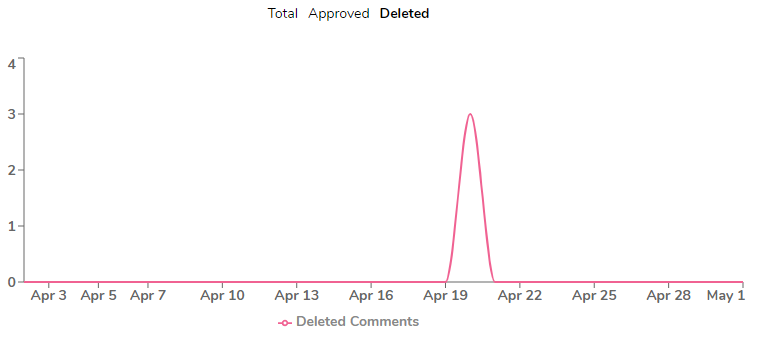
You can also see how many comment moderators approved or deleted by changing the active data type to "Approved" or "Deleted".
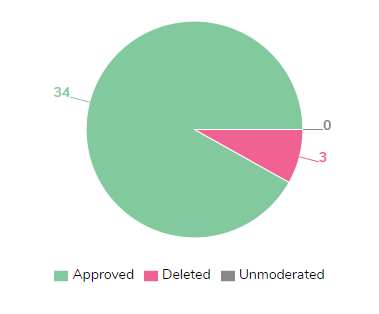
At the bottom, you can see a summary of your moderation history for each period in a pie chart.
The next one metric Pageviews. You can analyze how many page views you got.
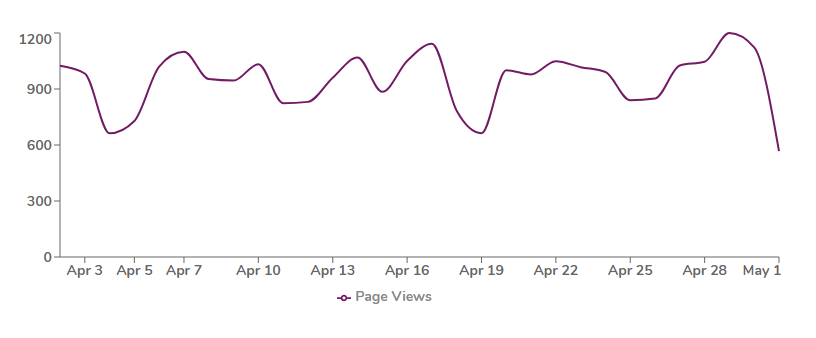
Number of pageviews is equal to the number of times the comments section loads on your website. If you use lazy loading, you will only see the number of visits that scrolled to the comments section. We track page views in the back end, which means that this page views count can be a little higher than what you will see in analytics solutions like Google Analytics because of bot traffic.
What's new in Appearance Customizing?
One of the most powerful features of Hyvor Talk is the appearance of customizability. You can now customize the comments section more than before.
Now, Hyvor Talk supports all Google Fonts! (988 fonts)
You can now set and customize
Shadow of the boxes
Corner roundness of the boxes
Box border size and color
Button roundness
These options can be used to create beautiful comment sections on your website. Feel free to play with the values and make things interesting.
All of these new options live in the Appearance -> UI section.
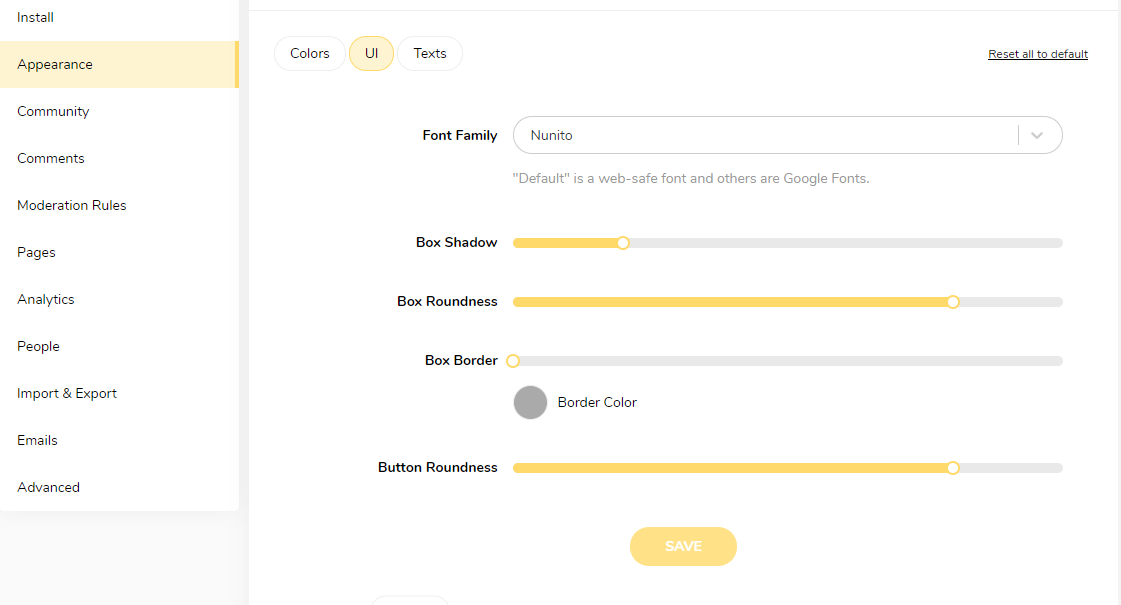
You can follow our appearance editing guide for some help.
What do you think of our new updates? Comment below!

Comments